This commentary is a response to the Center on Reinventing Public Education’s State of the American Student project, an effort launched in fall 2022 to track and report on pandemic recovery and school reimagining efforts over the next five years.
With two years of year-end assessment data in our hands, state leaders know that the impact of pandemic school closures has been extreme for students with disabilities, and also uneven.
During prolonged school closures, students received inconsistent special education and related services — or none at all. At the same time, some parents reported their students performed better from home during remote learning or had the chance to participate in grade-level instruction alongside their peers, when they would have been pulled out of mainstream instruction in pre-pandemic classrooms.
A state-ordered review of the pandemic’s impact on student learning in Arizona showed the negative impact on English Language Arts was moderate for students with disabilities yet large for those without disabilities. But in math, students with disabilities experienced some of the steepest drops in achievement. The disparate impact suggests that there may be more nuance to these scores, and it should prompt additional questions.
Unfortunately, how these trends affect students with different types of disabilities remains a mystery for most state policymakers. The current approach to reporting learning outcomes for students with disabilities perpetuates this by lumping all students into a single category.
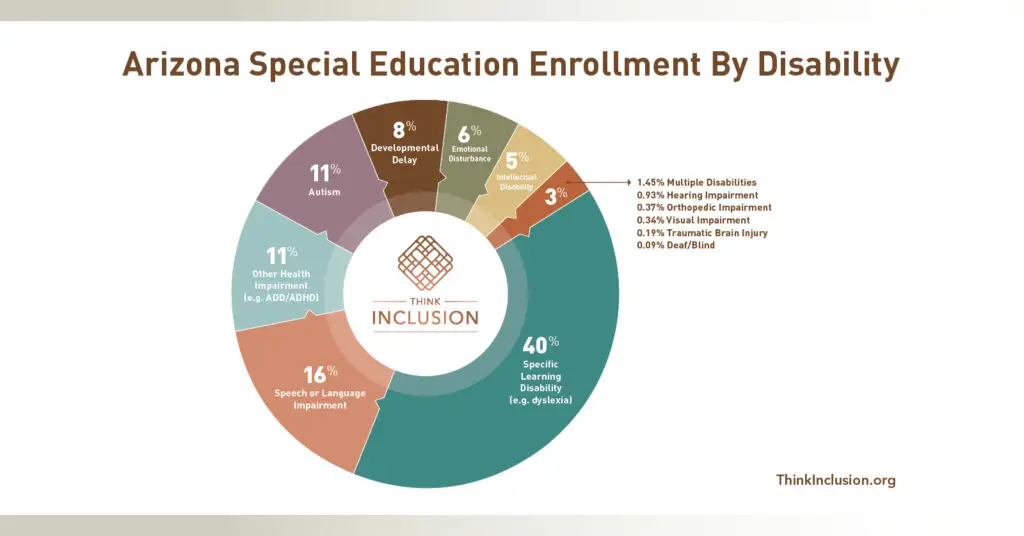
There are thirteen disability categories in federal law that allow students to qualify for special education services. They represent a diverse population of students with a wide range and severity of needs. Nearly 70% of students with disabilities come from only three categories considered to be mild in nature, such as specific learning disabilities (e.g. dyslexia) and other health impairments (e.g. ADD/ADHD). The remaining 30% of students have less common diagnoses such as hearing, visual, or intellectual disabilities.
In 2021, Arizona demonstrated that this can be done when the Board of Regents reported postsecondary attainment data by these categories. The result was a revelation. There were far more students with disabilities—particularly in the mild category—attending state community colleges and universities than we assumed. Further, many of these enrolled students struggle to complete their degrees, suggesting we needed to design new approaches to support them.
The first step to meeting students’ needs is understanding them. Every state department of education has the data needed to make the additional detail possible. Policymakers simply need to ask for it.
There is no average student, and that is especially true for students with disabilities. The very purpose of federal special education law is to recognize the unique needs of students and to provide the individualized services that help them succeed. The first step states can take to move in this direction is to report data in ways that better reflect students’ unique experiences.