As the recent debacle at Washington D.C.’s Ballou High school showed, it’s not always clear whether graduation rates mean anything about whether a student is prepared for college or career. But when it comes to students with disabilities, we have reason to believe high school graduation rates are simply a farce.
This past November, The Hechinger Report reported shocking variation across states when it comes to graduation rates for students who qualify for special education. Arkansas is on the high end, with 84 percent of students in special education earning a high school diploma. At the other end of the spectrum were states like Mississippi, where just 31 percent of students with a disability graduated.
We dug into the data to try to figure out what might explain the difference between these two southern, high-poverty states.
Does Mississippi have more severe special needs?
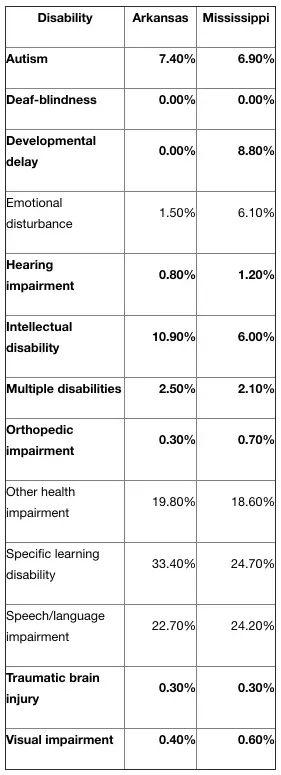
We began by looking at whether students in Arkansas have less severe disabilities than students in other states. Table 1 shows the 2015 special education enrollments by disability for Arkansas and Mississippi. We’ve bolded the disabilities that are generally considered most severe. Differences between the two states are slight and cannot possibly explain a nearly 50 percentage point difference in graduation rates.
Table 1. Students in special education by disability in Arkansas and Mississippi
Does Arkansas do better?
We used the only readily available proxy for student achievement (test scores) to see if there’s evidence that Arkansas students receive a high-quality education, justifying high diploma attainment. (We recognize that test scores are by no means a perfect proxy of achievement, especially for students with disabilities.)
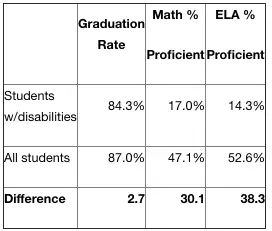
We compared graduation, math proficiency, and English language arts (ELA) proficiency rates for students with disabilities in Arkansas and for all students in the state. While there is less than a 3 percentage point difference in graduation rates, there is a huge 30 and 38 percentage point difference in math and ELA proficiency, respectively. Arkansas schools are graduating students with disabilities at almost the same rate as their non-disabled peers, but they are certainly not educating them at the same rate.
Alarmingly, a mere 14 percent of all disabled Arkansas students are deemed proficient in reading and 17 percent in math, but the vast majority are still graduating.
Table 2. Graduation and ACT Aspire proficiency rates in math and ELA
Does Arkansas have lower standards for graduation?
If students aren’t more significantly impaired and academic achievement isn’t remarkable, maybe it is simply easier to graduate from high school in Arkansas than in other states. In fact, several years ago (2013–14), Arkansas created new “Smart Core Course” graduation requirements, which create a more rigorous graduation diploma option from the traditional “Core” requirements. In math, for example, students can graduate if they have completed geometry, whereas algebra II is the requirement for the Smart Core degree. The difference between what students at each end of this spectrum know and can do by the time they leave high school is vastly different, yet their diploma is the same.
Arkansas students who still can’t pass lower-level courses have yet another path to graduation. For example, the Bryant School District explicitly states that students can receive a diploma if they “meet the requirements of their Individual Education Plan (IEP).”
Most likely, this helps explain the high graduation rates for Arkansas students with a disability. These students are graduating with lower expectations. This conclusion is reinforced by a study of career and technical education in Arkansas, which found that students with disabilities were substantially overrepresented in the career concentrations of “manufacturing” and “transportation, distribution, and logistics,” while underrepresented in “finance,” “health sciences,” and “education and training.” There are simply different career paths and expectations for students with disabilities in Arkansas.
Then what does a high school diploma mean for students with disabilities?
It seems clear from this data that the differences between Arkansas’s very high graduation rates and Mississippi’s abysmal rates is little more than lower standards for graduation. Is that something to celebrate?
Clearly, some disabilities prevent a student from being able to achieve academically at rates comparable to other students. As a former high school special educator and a parent, we support the notion of allowing all students a reasonable path to graduation. At the same time, it is all too easy for well-meaning educators to give up on students with disabilities, to graduate them without either the academic skills to enter college, the vocational skills to get a job, or the life skills to live independently.
Let’s face it. A high school diploma typically means almost nothing for students with disabilities. And no one is held accountable for improving the odds for students who face some of the greatest life challenges.
It’s past time to dramatically rethink what purpose a high school diploma should serve for students with disabilities, and perhaps for all students. At minimum, if alternative diplomas or routes to graduation, such as meeting IEP goals, are offered, they must be pegged to competencies or skills and reflect high expectations.
Rather than incentivizing inflated graduation rates, states should ask schools and districts to demonstrate that they have serious intervention and support systems for students with disabilities; that they are finding innovative new ways to prepare more of them for college and life; and that they can demonstrate success with ever-increasing rates of college and career placement and other measures of long-term life success.
At the end of the day, we need to find better ways to prepare students with disabilities for college and life, not just pass them off to the next system to let them down.
This blog originally appeared as a submission to Fordham’s 2018 Wonkathon.