

When asked about school quality, public school parents tend to be pessimistic about how good the nation’s schools are overall, but happy with their own children’s school. This disconnect is a long-standing finding from survey research, but it’s not the only inconsistency in how parents view public schools.
When we surveyed 3,208 families across eight “high-choice” cities last March about the mix of academic programs in their cities’ schools, we found a similar disconnect, but with the poles reversed: in our survey, families said that their city schools offered a wide mix of academic programs but that they, personally, had few options when it came to choosing a school. What should we make of this?
First, the good news. Critics and advocates of school choice alike worry that today’s charter-heavy systems are increasingly populated by look-alike schools, especially “no-excuses” schools that tend to focus narrowly on reading and math achievement, have longer school days and/or years, use strict behavioral management systems, and are good at producing test-based accountability results. People worry about a lack of program diversity in schools (whether it’s “no excuses” or some other model) because if all schools offer the same program it would short-circuit one way that school choice, in theory, is supposed to benefit students: by allowing them to find a school that’s a good match for their learning needs.
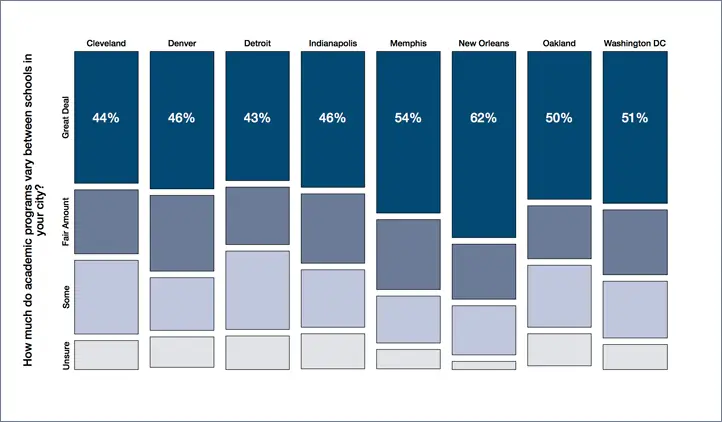
Our results suggest that schools in the survey cities were not all the same flavor. In fact, between 43 percent (Detroit) and 63 percent (New Orleans) of families in our survey reported that academic programs vary “a great deal” between schools in their city (the survey asked a separate question about how much education quality varied across schools).
Parents’ Perceptions of How Much Academic Programs Vary in Eight Cities

Notes
Plot: Viewed vertically, the tiles in this mosaic plot represent the relative share of responses to the question: How much do academic programs vary between schools in your city? For example, the top left “Great Deal” tile occupies 44% of the vertical space for Cleveland. Viewed horizontally, the tiles represent the number of respondents in each city, which in this case is nearly equal at around 400 (we had slightly more respondents in Denver, Memphis, New Orleans, and Washington, D.C.).
Source: March 2017 CRPE survey of families in eight cities. In each city, 400 families were randomly selected by telephone using a combination of landline and cell phone numbers and asked about their experiences with school choice. Results were weighted based on Census Bureau estimates for age, race, and educational attainment.
Our results resonate with prior studies (see here, here, and here) that used printed parent guides and school websites to gauge the diversity of school program offerings in a handful of high-choice cities. These studies suggest that school systems in cities like Denver, New Orleans, and Washington, D.C., include a range of curricular and programmatic offerings, from college-prep to special curricular themes and a variety of enrichment programs.
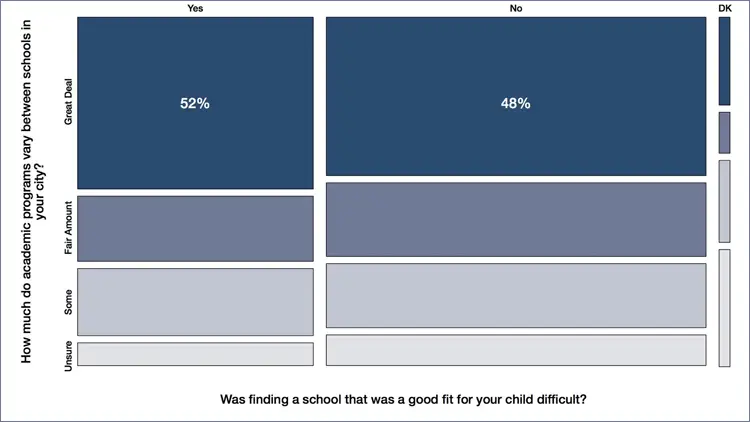
But then there’s the disconnect. Just like the families who think the nation’s school system is struggling but their own school is great, families who reported that their city offers a “great deal” of program diversity still reported having trouble finding a school that was a good fit for their child and that they had few good options besides their current school. It turns out that parents who said they had trouble finding a good fit answered the program diversity question in about the same way (52 percent “great deal of variation”) as parents who said they didn’t have trouble finding a good fit (48 percent “great deal of variation”). The results were similar across cities: the following mosaic plot shows the pooled results. (As in the prior plot, viewing the tiles vertically shows the relative share of responses to the question about program variation; viewing the tiles horizontally shows the relative share of responses to the question about fit.)
How Much Academic Programs Vary By Parents’ Trouble Finding a Good Fit

These results suggest there is a difference between how parents view the program variation that’s available citywide, and what they want for their children (they can’t, however, tell us why). So yes, education and civic leaders must think about the mix of schools in the system overall, but they must also seriously assess and address localized needs neighborhood by neighborhood and, importantly, ask parents what they want and need. Cities in the portfolio network are starting to do this work:
- In Denver, Denver Public Schools uses data from the city’s unified enrollment system to identify where schools are most needed. While the district vets potential operators, local community organizations have the final vote.
- In Washington, D.C., two nonprofits, Parent Amplifying Voices in Education (PAVE) and FOCUS, worked with a group of families in Ward 8 to spearhead the process of opening a new school on a nearby military base. A parent-led design team solicited input about what type of school families wanted using a community survey. The team then used the results to develop an RFP and vet applicants.
- In Memphis, the Community Launch program, operated through the Tennessee Charter Center, trains family and community members to provide informed feedback on the quality and fit of charter school applications. Cohort members go through a six-month training course on current regional models, the qualities of successful schools, and existing community resources. Members of the first cohort provided critical input on a charter application, prompting the operator to withdraw the proposal and decide to resubmit when it was better prepared.
- In Cleveland, the Cleveland Metropolitan School District (CMSD) is developing a system for families to provide feedback on all new school models. The district supports the development of community-led design teams, which solicit input from families and neighborhood groups. Based on identified community values, district staff suggest school models that may be a good fit. CMSD also identifies community assets that schools may be able to leverage. For example, the district has opened a tech-focused school on the west side of the city near both manufacturing and IT firms.
Leaders of these initiatives know that—just like school quality—when it comes to school choice, families’ hopes, successes, and disappointments are often more localized than not. The upshot is that system leaders must listen to their communities, and build and support a citywide supply of schools that offers real and responsive choices to families where they need them most.
